HTML
Research Article - (2023) Volume 13, Issue 2
Prostate Cancer Identification And Classification From Microscopy Scans Of Prostate Biopsy Samples Using Machine Learning Algorithms
Bhuvanesh Baniya1*, Vivek Jain1, Kajol Rustage1, Nema Ram2, Ritika Dadhich3 and Baulal Patel4*Correspondence: Bhuvanesh Baniya, Department of Pharmaceutical science, University of Mohanlal Sukhaida, Udaipur, Rajasthan, India, Email:
2Department of Pharmaceutical science, B.N College of pharmacy, Udaipur, Rajasthan, India
3Department of Pharmaceutical science, B.N College of pharmacy, Udaipur, Rajasthan, India
4Department of Pharmaceutical science, University of Jai Narain Vyas, Jodhpur, Rajasthan, India
Received: 18-Feb-2023, Manuscript No. IJP-23-89550 ; Editor assigned: 21-Feb-2023, Pre QC No. IJP-23-89550 (PQ); Reviewed: 10-Mar-2023, QC No. IJP-23-89550; Revised: 21-Mar-2023, Manuscript No. IJP-23-89550 (R); Published: 29-Mar-2023, DOI: 10.37532/2249-1848.2023.13(2).36
Abstract
This research explores how to apply Machine Learning (ML) to prostate MRI within the field of radiology MRI. The fundamentals of Machine Learning (ML) and traditional rule-based algorithms are first covered, followed by a discussion of supervised, unsupervised, or reinforcement learning. In the last part of this article, the distinctive characteristics of Deep Learning (DL), an emerging kind of machine learning, are dissected in minute detail. Although ML and DL both possess the potential to really be employed for prostate MRI, the manner in which they accomplish this goal are different. Plain MRI is used in every one of the clinical contexts that are listed below. Detection and diagnosis of prostate cancer, as well as repeatability of location readings; differentiation of malignancies from benign hyperplasia associated with prostatitis; local staging or pre-treatment evaluation. The therapeutic applicability of these results seems to be promising; nevertheless, in order to fully appreciate their potential, more validation will be required across a variety of scanner manufacturers, field strengths, and institutions. Our healthcare systems are being transformed by Artificial Intelligence (AI), which refers to the ability of a computer to conduct out cognitive processes to attain a goal based on the information supplied. Artificial Intelligence (AI) refers to a computer’s ability to reason its way to a solution based on the data at hand. Artificial Intelligence (AI) is defined as the capacity of a computer to perform cognitive activities in pursuit of a goal using just the information it has been supplied. Bioinformatics, medical imaging, but instead healthcare robotics is just a few examples of fields that have benefited from the widespread availability of powerful computers, sophisticated information processing algorithms, and cutting-edge image processing software capable of extremely fast processing speeds. This is the case for two reasons: first, as a consequence of an availability of ever-increasing computing capabilities, computer-based systems that are also trained to perform complicated things have emerged in. The development of AIs specifically designed to carry out such activities has made it possible for computer systems to assume such responsibilities. Computer-based systems that can be configured to do the aforementioned tasks have progressed to the point where they can actually perform those tasks. Having access to "big data" has made it possible for "cognitive" computers to sift through vast amounts of unstructured information, pull out the pertinent details, and confidently identify previously hidden patterns. Machine Learning (ML)-based computerized decision-support systems may transform healthcare by performing challenging tasks now performed by specialists. The medical field would be forever altered if this were to happen. These responsibilities include, but are not limited to, reducing human resource costs, increasing throughput efficiency, optimizing clinical workflow, extending treatment alternatives, and strengthening diagnostic precision. These features may be particularly helpful in the diagnosis and treatment of prostate cancer, where they are increasingly being used in areas such as digital pathology, genomics, surgical procedures, competency assessment, and training and evaluation of surgical abilities. Urologists, oncologists, radiologists, and pathologists use imaging and pathology frequently and should be familiar with this emerging field. They should also be aware that the development of highly accurate AI-based decision-support applications of ML will necessitate the cooperation of data scientists, computer researchers, and engineers. The medical industry must advance in order to remain competitive. Specialties such as urology, oncology, radiology, and pathology make extensive use of imaging and pathology.
Keywords
Prostate cancer, Diagnostic, Imaging, Pathology, Microscopy scans.
Introduction
Diagnosing Prostate Cancer (PCa) has always been difficult. Prostate-Specific Antigen (PSA) testing is now considered the gold standard for diagnosing prostate cancer; nevertheless, its discoverer, Richard J. Ablin, has emphasized on many occasions that this test has significant shortcomings. Due to the fact that PSA was identified in 1970, this is the case. However, it is better to deal with the devil you know rather than the one you don't owe to the paucity of diagnostic procedures available and the velocity with which PCa may grow and become fatal [1].
Researchers first from Icahn School of Medicine at Mount Sinai and indeed the Keck School of Medical Sciences at the University of Southern California (USC) have now provided information on such a revolutionary machine-learning framework that they designed to improve the precision and agility of illness diagnostics. The framework was designed to improve the speed at which illnesses can be diagnosed. The paradigm that is being provided here enables the most precise categorization of low-risk and high-risk prostate cancer that has been possible to date. The recent study, which is published in scientific reports in an article titled "Objective risk stratification of prostate cancer using deep learning together with radionics implemented to multi parametric magnetic resonance images," provides a framework to help medical professionals, particularly radiologists, identify treatment options for PCa patients much more accurately, and thus further delineating the disease's risk.
By combining multiparametric MRI (mpMRI) with Prostate Imaging Reporting and Data System (PIRADS 2), (PI-RADS v2), which is a five-point scoring system for categorizing lesions discovered by mpMRI, it is now possible to identify lesions in the prostate. The prostate cancer risk assessment procedure makes use of PI-RADS v2 as one of its tools. These diverse approaches are being pursued in the expectation that, when brought together, they will result in an improvement in the degree of precision with which it is possible to forecast the likelihood of clinically significant prostate cancer. Specifically, the researchers hope that this will be the case. As a result of its subjectivity and the fact that it does not provide a distinct demarcation between the intermediate and malignant phases of cancer, the PI-RADS v2 scoring system is often interpreted in a variety of different ways by diverse doctors (scores 3, 4, and 5) [2].
Methods and Materials
Classification, cross-validation, and statistical evaluation are all parts of the paper's rigorous and methodologies. This strategy was developed to identify the best classification for PCa risk prediction based on radiomic features collected from mpMRI in a large population. The goal of this study was to determine the best classifier for predicting prostate cancer risk; this study details a thorough and strict approach. The process has included categorization, testing, and statistical analysis. The authors claim that "this classifier worked effectively in an independent validation set," outperforming PI-RADS v2 in several respects. Using radionics and classification techniques, this "shows the necessity for objectively assessing mpMRI pictures for PCa risk assessment".
It has been suggested to alleviate this limitation by merging machine learning with radionics, a branch of medicine that use algorithms to extract enormous volumes of quantitative information from medical photographs. This is only one of many alternatives, but it's a viable one. Several studies have attempted to get around this restriction by isolating and studying a smaller selection of machine learning methods. In order to determine which techniques had the best chance of succeeding, researchers from Mount Sinai and USC created a prediction framework. Moreover, the approach makes use of far bigger data sets for training or validation than were previously available. These sets are essential for the framework to perform its intended functions. Scientists have used this finding to categorize pica in patients with great sensitivity and, in certain cases, even higher predictive value.
Results and Discussion
Detecting prostate cancer using machine learning:
The IR spectral prostate cancer is common, and when it spreads to other organs, it is almost always fatal. 2019 statistics showed that prostate cancer was the second most common malignancy among males worldwide (following bronchus and lung cancer). Methods of detection used in the field of medicine that include imaging modalities, such as ultrasonography and Magnetic Resonance Imaging (MRI), despite their extensive use in prostate cancer diagnosis, have limited diagnostic utility owing to low resolution and high costs. As a result, it is still challenging to obtain the required high sensitivity, reproducibility, and least invasiveness during prostate cancer detection. Digital Rectal Exams (DRE) and PSA blood testing are the two most popular screening procedures for prostate cancer. A Trans Rectal Ultrasound (TRUS)-guided prostate gland biopsy may be suggested for the patient if abnormalities are found. As an added complication, many US pictures of prostate cancer tumors appear to be of the isoechoic origin or to resemble other benign prostatic disorders. These advantages are unique to Photoacoustic (PA) spectroscopy, a relatively new molecular imaging technique. Delivering high-contrast pictures with sub-millimeter pixel sizes and acoustic scanning ranges of several meters, it is ideal for detecting and studying subsurface features. In response to the generation of a PA signal, biological tissues convert electromagnetic energy into thermal energy, leading to a rise in local pressure or thermal-elastic expansion of those tissues.
Once the pressure has been amplified, it will spread as acoustic waves, which may be detected by acoustic sensors and turned into amplification & propagation PA signals. Spectroscopic PA scanning is used in many fields of medicine and science for distinguishing between various types of tissue due to their unique optical absorption spectra. Photoacoustic Physiochemical Analysis (PAPCA) has demonstrated promising results in the identification of prostate cancer. Due to differences in their chemical bonding and vibration patterns, different bio-macromolecules absorb and emit light in unique ways, making them visible only under certain lighting conditions. Additionally, the ultrasonic power spectra of the PA signal may be utilized to classify biological tissues according to their acoustic features. This method, which makes use of both optical and ultrasonic qualities, has the potential to assess the microscopic histologic features and chemical compositions of the prostate tissue simultaneously with high resolution and minimum incursion sensitivity. Research into aberrant detection and evaluation, the development of diagnostic tools, and the elimination of limitations in existing imaging technologies for prostate cancer diagnosis are all critical steps for progress in this field [3].
PA imaging is one of several possible imaging methods for detecting prostate cancer, but it shows the most promise. This hybrid imaging technique included first irradiating a sample of tissue with pulsed laser beam in the Near-Infrared (NIR) region, and then detecting the US wave emitted by the tissue. Light-absorbing tissue components are immersed inside the light pulses, causing rapid thermal expansion and pressure raises at the absorption sites. The pressure boost results in discharge in the form of PA waves or broad-band US waves. Researchers have figured out how to recognize these PA waves using US transducers, and they've been utilizing them to make all sorts of 1D signals and 2D grayscale pictures. The tissues optical absorbance characteristic determines how much light is gathered by its components, and hence the intensity of the PA waves. Imaging methods that take use of tissue sample’s optical properties may be able to gain relevant information from the sample. However, functional data, including such as regional changes in tissue blood content, may be used to detect angiogenesis.
Malignant tumors have aberrant blood vessel growth. Analyzing the tissue and searching for evidence of angiogenesis may be done using either PA imaging or traditional optical imaging using pulsed lasers in the Near-Infrared (NIR) frequency range. Traditional optical imaging suffers significantly from resolution loss as depth into soft tissue develops, in contrast to PA imaging, where spatial resolution remains fairly adequate at great depths into soft tissue. PAPCA may have a number of medical applications, including but not limited to: the detection of liver illness and bone disorders; the imaging of microvascular structures; the identification of prostate cancer; and the detection of crohn's disease and its associated inflammation and fibrosis. The detection of lipids or heamoglobin with PA has been proposed as a means of identifying prostate cancer. The present research on frequency-domain and time-domain PA spectra and their potential use in diagnosing prostate cancer focuses mostly on extracting the physical quantization component. For the assessment of prostate cancer, the information offered by individual variable extraction has been limited, thus this method must be refined to increase its accuracy (Figure 1) [4].

Figure 1: Machine learning aid in evaluating prostate MRI.
ML for the treatment and intervention of patients and ML in prognostic imaging:
The same machine learning methods that were discussed in relation to imaging for diagnosis may be used to the design and implementation of therapeutic interventions. Using a feature-enabled ML predictor for External Beam Radiation Treatment (EBRT) and brachytherapy, prostate cancer was detected in mpMRI. The deformable mapping between mpMRI and CT at the expected cancer sites was co-registered using this predictor. This might lead to more exact therapeutic preparation. After that, specific plans for each patient’s course of therapy were developed after taking into account where the cancer was most likely to spread.
ML in prognostic imaging:
Accurate interpretation of radiographic cross-sectional images, such as those acquired with Computed Tomography (CT) or Magnetic Resonance Imaging (MRI), relies on the identification of complex patterns. You can train a computer to perform work like this very quickly, correctly, and efficiently. X-ray and Magnetic Resonance Imaging (MRI) scans provide such images. Low-level computational methods are responsible for pixel classifications for fundamental image evaluation tasks such as registration and segmentation. More sophisticated methodological techniques may provide information useful for detecting, classifying, and assessing prostate cancer. For evaluating synthetic prostate images, ML technologies may be broken down into two categories: low-level computational techniques and higher-level procedures. Low-level computer methods are responsible for classifying pixels for fundamental picture evaluation tasks such as registration and segmentation. These methods are center on pixel classifications for widespread image analysis tasks including registration and segmentation (especially MRI). We started by developing a preliminary classification scheme for approaches based on theoretical, analytical, and biomechanical evaluations. When this was completed, the problem was attacked using model-based calculations, computer vision, and picture processing. Depending on the machine learning technique used and the degree to which the classes at hand exhibit variance for summary-level visual interpretation and assessment, a large range of training data set sizes may be necessary for effective categorization. Whereas hundreds to thousands of observations are needed for hand-crafted feature-based prostate cancer classification, maybe hundreds of thousands more are required for CNN-based algorithms. Learning from a single patients imaging or pathology does not need thousands of patients with the right "leave-patient-out" assessment. However, this goal may be met without enrolling tens of thousands of patients.
Recent developments in machine learning have made it feasible to examine the physiochemical spectrum of PA in great detail for the first time. Analyzing gene expression patterns has made extensive use of unsupervised machine learning methodologies like hierarchical cluster evaluation. These approaches illustrate the immense potential of deep data mining by focusing on the hidden connections between genes that are difficult to identify directly using conventional methods. Finding these links explicitly using other approaches is challenging. Classification methods, which fall under the umbrella of supervised machine learning, may have their accuracy vastly improved by the creation of a categorization methodology for variable optimization that is based on training-data instances and labelling. One manner in which this enhancement may be achieved is by doing so. Several machine learning therapeutic applications have showed considerable potential, including the detection of cancers including breast cancer, brain tumors, and lung cancer. In light of this, the possibility that machine learning may be applied to evaluate PA spectrum data and improve prostate cancer diagnosis accuracy is not only possible but also makes perfect sense (Figure 2).

Figure 2: Machine learning applications in prostate cancer.
Prostate cancer identification and classification:
The obtained PA power spectrum has been segmented by wavelength in preparation for the construction of the actual PA physio-chemical spectra. The spectrum may be used to differentiate between normal tissues and malignant ones. The PA physio-chemical signal of the malignant tumors in both locations is noticeably higher than that of the healthy tissues (orange box with dashes). It would seem that heamoglobin is the principal source of energy for light and sound in the range of 680-940 nm. Tumor tissues have much higher total heamoglobin content than healthy tissues do, as a result of the obvious growth of blood vessels that occurs with the progression of cancer. This is what causes the color of tumor tissues to be noticeably darker than that of healthy tissue. Lipids and collagen seem to be the primary PA sources in a wavelength range of 1200 and 1370 nm. Carcinogenesis is characterized by a rise in the concentration of collagen and lipids in prostate tissue. This increase is mirrored in the heightened signals that collagen and lipids generate. The spectra of PA signal intensity may be compared to the light-absorption spectra of other biomolecules, which can provide some information on the process of signal amplification at these two locations.
Examining the relationship between bio-macromolecules in prostate tissue using PA physiochemical spectra:
In the fields of cluster or taxonomy study, the use of colored dots to signify proximity and the real data matrix is not new and has been shown helpful for better design and recovering degraded structures. Unweighted Pair Group Method with Arithmetic Mean (UPGMA) and main component analysis were used to categorize all 77 wavelengths into six groups. The spectra of light absorption by the biomolecules have already been compared to the results of the clustering to confirm the accuracy of the results produced from the clustering. This wavelength grouping is very close to the set of unique biological macromolecules that absorb light, even if the 77 leaf nodes of the cluster tree are not ordered in the order 0-76. The chemical bonding & vibrational patterns of bio-macromolecules also lead them to absorb light in unique ways. UPGMA may also help with spectral change analysis by guiding the selection of wavelength detection bands in which PA signals generated by different bio-macromolecules prevail. The statistical significance of each tissue test wavelength cluster has been determined [5]. Because the main macromolecules in healthy and malignant cells are similar, there was little to no difference in the clustering findings between the two kinds of samples. The various correlation strengths between and within the various chemical groups were mirrored in the various intensities of the pseudo colors. Since the results were affected even if the group’s relative positions were maintained all throughout UPGMA clustering method, this model includes the previously presented studies. As a result of the vascular systems independence from the distribution of the other elements, the vascular correlation groups from all these samples showed little evidence of linkage with the other clusters. When comparing healthy and cancerous tissues, we also saw that the intergroup link between W1 and W2 and W3 and W6 was greater (the color was darker) inside the malignant tissues. Since W1 and W2 are so closely linked, we've decided to classify them as a single entity. This connection is made abundantly evident by the network maps showing all statistical test results. Three markers of improved intergroup communication may emerge from this study [6].
(1) Cancerous tissues network maps feature more edges than those of healthy tissues
(2) The nodes in the cancerous-tissue network map are much bigger.
(3) There are more nodes on the malignant tissue network map.
Prostate cancer growth causes microstructural changes in both collagens and lipids, highlighting a hitherto unsuspected link between these two biological macromolecules. Collagen fibers give sufficient structural support for prostate tissues, while lipids make up the majority of the cell membrane in exosomes found outside the body. They are located all around the company; thus, their distribution methods are varied. However, the surrounding environment changes and indeed the metabolism seem to be aberrant when prostate tissues become malignant. Due to the tumor microenvironment's heterogeneity, the distribution properties of a single medication become more diffused and their overlap becomes more extensive, thereby increasing the complexity of PA spectra.
The application of cluster or correlation analysis to categorize predicted wavelengths on the basis of power similarity might provide a robust benchmark for discriminating between different biological macromolecules. This study adds to the growing body of data supporting the use of PA physio-chemical spectra for the diagnosis of prostate cancer by demonstrating that these spectra properly represent the alterations in bio-macromolecule microstructure that occur throughout the progression of prostate cancer [7].
Prostate Cancer Identification using SVM, NB, C4.5, and LDA:
While cluster and correlation tests suggest that the PA physio-chemical spectra may adequately reflect the various microstructural variations found in biological macromolecules, the overall correlation is substantially larger (>0.75), suggesting that duplicate observations have always been present. There are too many connections between the items to solve the categorization issue. Separating cancerous from healthy tissue is an essential step in detecting prostate cancer. Noise in the wavelength dimensions was reduced, factors that may better define cancer characteristics were identified, and the accuracy of cancer diagnoses was increased thanks to the application of LDA, SVM, NB, and C4.5 algorithms. In order to look into the 97 data distribution, this research analyzed the mapping values for all of the data under multiple ML models after training the LDA model at different frequency points. The distribution of mapping values over the training data split roughly in half. There had been 50 healthy samples up front, but 47 cancerous ones afterwards. The estimated mapping values of something like the healthy sample were completely uncoupled from the constant value of the tumor sample when the original distributions were exposed to a threshold. There hasn't been a reliable threshold to differentiate tumor samples from control samples until recently. Frequency points of mapping-value distributions without overlapping areas improved the accuracy with which classes of normal and malignant samples were recognized. Changes in efficiency are seen throughout frequency ranges, and it seems that this is because of variation in data quality. Optimal differentiation, according to the theory underlying the LDA method, can be achieved by locating a linear mapping that maximizes the variance between categories while minimizing the variance within categories. The fact that the respective data qualities are slightly varied contributes to LDA's discriminating strength at these two frequency ranges. Evidence suggests that [8].
This is primarily owing to the fact that the model's potential to define or explain sick features is particularly frequency-dependent, as it relies on the size of the chromophore we are targeting, which fluctuates with frequency. A short summary of the selected frequencies and how they were used to detect prostate cancer. Using the mean of the predicted mapping variables at these frequency intervals as the classification process eigenvalue, this combination evaluation approach has been used to enhance diagnostic accuracy. In addition, after doing 10-fold crossvalidation 2-3 times on a total of 97 samples, the overall assessment revealed a reliability of 958.2% was attainable. This level of precision is on par with that of other diagnostic tools often used in hospitals, such as multi-mode Ultrasound (US), which achieves an accuracy of around 71.7%, or Magnetic Resonance Imaging (MRI), which now has achieved a precision of about 80%. So, when applying the LDA approach, PA spectroscopy is equally as successful as US and MRI at identifying prostate cancer. In principle, while the correlation matrix remains unchanged, LDA performs very well in classifying data. As a result, it is reasonable to assume that the analytical upper range that LDA may attain will become easier to predict as more data is gathered, especially the covariance matrices (Figure 3) [9-11].

Figure 3. Prostate cancer diagnosis using machine learning.
Evolution criteria and metrics:
Evaluation of the efficacy of prostate cancer detection is performed using well-established criteria, which enables comparison with other techniques already in use. The selection of a suitable assessment measure is contingent on a number of different aspects, one of which is the functioning of the system. In addition, assessment metrics are an essential component in determining how accurate the outputs of categorization models are. The findings of this investigation were analyzed utilizing sensitivity, accuracy, and specificity with the help of the model that was provided [12-15].
Accuracy:
The term "accuracy" refers to the proportion of the total number of texts that correspond to the number of cancer cases that were correctly categorized. Accuracy has been used as a parameter for assessment purposes in the process of determining whether or not the learning approaches are helpful in the identification of prostate cancer. The aggregate number of flows that are correctly detected across all classes is what the accuracy metric attempts to quantify [3].
Calculating accuracy involves:
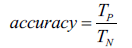
Where, it represents the total number of input samples that do not belong to a certain category and reflects the number of errors in a particular class's predictions that have been accurately detected after being rectified.
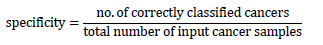
Specificity:
The ratio of the total number of cancer patients who legitimately belong to a class to the total number of cancer tissues that have been reliably assigned to a class is the formula for calculating specificity.
The calculation for specificity is as follows:
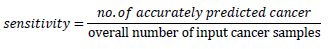
Sensitivity:
The term "sensitivity" refers to the proportion of malignant tissues that can be reliably classified as belonging to a given class relative to the total number of input samples that can be classified as belonging to that class. Because it is so susceptible to incorrect classification, sensitivity is an extremely essential metric in determining the results of cancer classification. Furthermore, erroneous categorization led to outcomes with a lower level of sensitivity (Figure 4).

Figure 4. Machine learning accuracy in spotting prostate cancer.
Calculating sensitivity involves:
Conclusion
This study compared the PA physio-chemical spectrum of normal prostate tissues to that of cancerous prostate tissues. The creation of diagnostic algorithms for prostate cancer was the outcome of this scientific activity. Furthermore, the many macromolecules present in both healthy and malignant cells were analyzed for their linkages using the UPGMA cluster analysis method. This prompted the study and subsequent mapping of the light-absorption zones of a wide range of biological macromolecules. Malignant prostate tissues were shown to have much greater power-spectrum correlations for heamoglobin, collagen, and lipids compared to normal prostate tissues. This held true for all three of these chemicals. This results in a more uniform distribution of the various biological components and a greater degree of microstructural similarity between them. The visualization data of samples, both healthy and malignant, were utilized to reach these conclusions. Furthermore, four distinct methods for identifying prostate cancer are used in this study. These methodologies are referred to as the SVM method, the C4.5 methodology, the NB method, and the LDA method accordingly. Provided models have proven beneficial in boosting accuracy. To be more explicit, the LDA model has achieved 95.8% accuracy, the NB model has obtained 95.2% accuracy, the C4.5 model has won 97.3% accuracy, and the SVM model has reached 96.8% accuracy. This study's findings lend credence to the idea that combining ML and PA physio-chemical spectroscopy is a viable option for studying prostate cancer's unique microscopic architecture and chemical makeup. This conclusion was made as a direct consequence of the outcomes of this specific investigation. This helps to assure that patients have the most precise treatment available and contributes to the ease of the procedure of recognizing this ailment. It also aids in the speedy diagnosis of medical conditions. It is important to gather new data and make big alterations to the process of categorization if one wishes to reach an even better degree of diagnostic accuracy. Either one or the other could do the trick. The efficacy of the technique in practice may be enhanced by further distinguishing between benign and malignant tumors within the classification. To improve the method's overall usefulness, this partition is necessary.
References
- Barlow H, Mao S, Khushi M. Data. 2019;4(3):129.
- Bhardwaj H, Saxena R, Tyagi S. Int J Res Appl Sci Eng Tech. 2020;8(8):649-655.
- Chen R. medRxiv. 2020:2020-2104.
- Fiano R. West Virginia University. 2021.
- Hectors SJ, Chen C, Chen J, et al. J Magn Reson Imaging. 2021;54(5):1466-1473.
[Crossref] [Google Scholar] [PubMed]
- Jović S, Miljković M, Ivanović M, et al. Cancer investig. 2017;35(10):647-651.
[Crossref] [Google Scholar] [PubMed]
- Alkhateeb A, Atikukke G, Rueda L. J Cancer. 2020;1(3):70-75.
- Michaely HJ, Aringhieri G, Cioni D, et al. Diagnostics. 2022;12(4):799.
[Crossref] [Google Scholar] [PubMed]
- Ghosh P, Mitchell M, Tanyi JA, et al. Mach Learn Appl. 2010;752-757.
- Cancer Discov. 2021;11(12).
- Passera R, De Luca S, Fiori C, et al. Korean J Urol Oncol. 2021;19(3):164-173.
[Crossref] [Google Scholar] [PubMed]
- Rammal A, Assaf R, Goupil A, et al. BMC Bioinform. 2022;23(1):1-22.
[Crossref] [Google Scholar] [PubMed]
- Wang J, Wu CJ, Bao ML, et al. J Magn Reson Imaging. 2018;48(2):499-506.
[Crossref] [Google Scholar] [PubMed]
- Yi Z, Hu S, Lin X, et al. Eur. J Nucl Med Mol Imaging. 2022:1-2.
[Crossref] [Google Scholar] [PubMed]
- Özhan O, Yağin FH. J Cogn Syst. 2022;7(2):17-20.
Manuscript Submission
Submit your manuscript at Online Submission System
Google scholar citation report
Citations : 1101
International Journal of Pharmacy received 1101 citations as per google scholar report

International Journal of Pharmacy peer review process verified at publons

Indexed In
- CAS Source Index (CASSI)
- HINARI
- Index Copernicus
- Google Scholar
- The Global Impact Factor (GIF)
- Polish Scholarly Bibliography (PBN)
- Cosmos IF
- Open Academic Journals Index (OAJI)
- Directory of Research Journal Indexing (DRJI)
- EBSCO A-Z
- OCLC- WorldCat
- MIAR
- International committee of medical journals editors (ICMJE)
- Scientific Indexing Services (SIS)
- Scientific Journal Impact Factor (SJIF)
- Euro Pub
- Eurasian Scientific Journal Index
- Root indexing
- International Institute of Organized Research
- InfoBase Index
- International Innovative Journal Impact Factor
- J-Gate